Resources – Scripting node
The Scripting node allows users to enhance their workflows by adding custom calculations in the form of e.g. R- or Python scripts. Result tables from Compound Discoverer can easily be exported, read and processed by a script and the results can be returned as new columns or new tables into Compound Discoverer. Please find below the manual as well as examples.

This manual was written for Proteome Discoverer but the same concepts also apply to Compound Discoverer.Download
The latest version of the user guide for Custom Script integration can be found here.
Examples
BY DOWNLOADING ANY SOFTWARE, SCRIPTS, TEMPLATES, DOCUMENTATION AND/OR OTHER MATERIALS (COLLECTIVELY “MATERIALS”) FROM THIS WEBSITE, YOU AND ANY COMPANY OR INSTITUTION YOU REPRESENT (COLLECTIVELY “YOU”) ACKNOWLEDGE AND AGREE AS FOLLOWS: (1) THE MATERIALS ARE PROVIDED “AS IS” WITHOUT WARRANTY OF ANY KIND, EXPRESS OR IMPLIED, AND (2) THERMO FISHER SCIENTIFIC INC., ITS AFFILIATES AND EMPLOYEES WILL NOT BE RESPONSIBLE FOR ANY DAMAGES ARISING FROM YOUR USE OF THE MATERIALS, INCLUDING BUT NOT LIMITED TO DAMAGES ASSOCIATED WITH LOSS OR CORRUPTION OF DATA, INACCURATE RESULTS, AND/OR DIMINISHED INSTRUMENT PERFORMANCE.
1.) Hello World (sort of, in R). A very simple example that demonstrates how to export a table (Compounds), read the Molecular Weight column, add a value (+H) and return the result as a new column to CD.
This example also shows how to register a node as a “standalone” scripting node, so that it appears in the list of the nodes like a “regular” node. Multiple scripting nodes can be installed that way and the usage can be simplified for the end user by hiding the underlying scripting mechanism. For CD3.1.
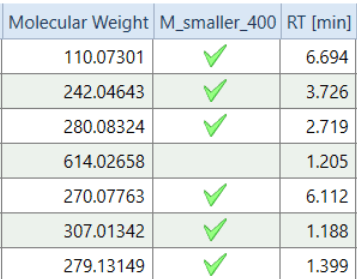
2.) CheckMark (R). An example how to use Options for Columns, here PositionAfter and SpecialCellRenderer. This script creates a column with green check marks for all compounds with molecular weight < 400. The new column will be positioned right after the Molecular Weight column in the Compounds table. For CD3.1.
3.) Calculate mass difference for Features (Python). This example script in Python calculate the mass difference between Molecular Weight and m/z * charge in the Features table. The result is returned as a new column. For CD3.1.
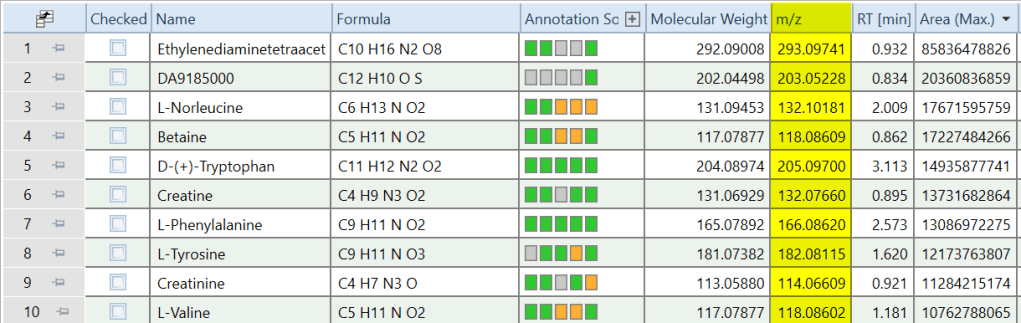
4.) Add m/z column to the Compounds table (R). This script creates a column with m/z values for each compound, positioned right after the Molecular Weight column in the Compounds table. To populate the “m/z” column it currently performs the following procedure. For each compound, it finds the sample with highest abundance for this compound, looks for a molecular ion, uses ion with highest abundance if a molecular ion was not detected. This can of course be customized to select representative m/z values in a different way. For CD3.1. Not needed (built-in) in versions CD3.3 and higher.
5.) Add m/z and Delta Mass [ppm] columns to the Expected Compounds table (R). This script creates a column with m/z values for each expected compound, based on features detected in the sample with highest abundance for this compound. It also copies the delta mass in ppm for this feature to the Expected Compounds table. For CD3.1. Not needed (built-in) in versions CD3.3 and higher.

6.) Calculate O/C and H/C ratio (R). This script calculates the O/C and the H/C ratio for each compound and returns the result as two new columns to the Compounds table.

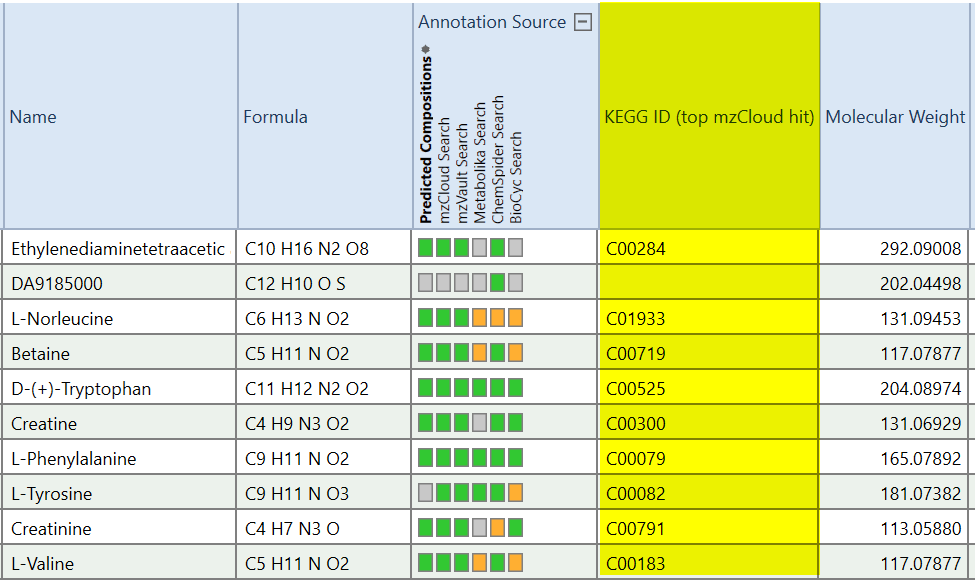
7.) Show KEGG IDs in the Compounds table (R). This script creates a new column “KEGG ID (top mzCloud hit)” in the Compounds table. It looks up the KEGG ID of the top mzCloud hit for each compound in the mzCloud Results table and copies it into the new column. For CD3.1. Not needed (built-in) in versions CD3.3 and higher.
8.) Calculate logP values (R). This script creates a new column “logP” in the Compounds table. It uses OpenBabel to calculate the logP value for the currently assigned structure for each compound.

9.) Export to BioCyc (R). Compound Discoverer includes the capability to map compounds to BioCyc pathways and visualize pathways with omics data overlay directly in CD. However there is much more you can do with BioCyc, like the Cellular Overview with interactive omics data overlay (screenshot below), the Omics Dashboard, a pathway collage etc.
This script exports Compound Discoverer results to BioCyc using the BioCyc “Omics data file” format for import into BioCyc. Result files (.csv) will be written into the same folder where the cdResult file is located. A separate CSV file is generated for each BioCyc database (e.g. HUMAN, MOUSE, ECOLI, etc.) that was selected during the mapping process in CD. The result table is checked for duplicates (duplicated BioCyc IDs). It then removes all duplicates but the one with the highest overall peak area.

10.) Export the Compounds table with all ions (R). Export the Compounds table with all ions for each compound, instead of using only the reference ion.
for Compound Discoverer 3.3 :
for Compound Discoverer 3.4 (also includes in-source fragments):

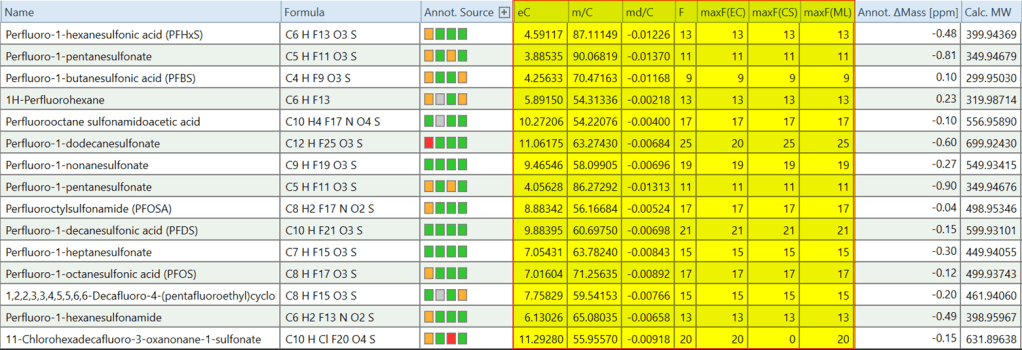
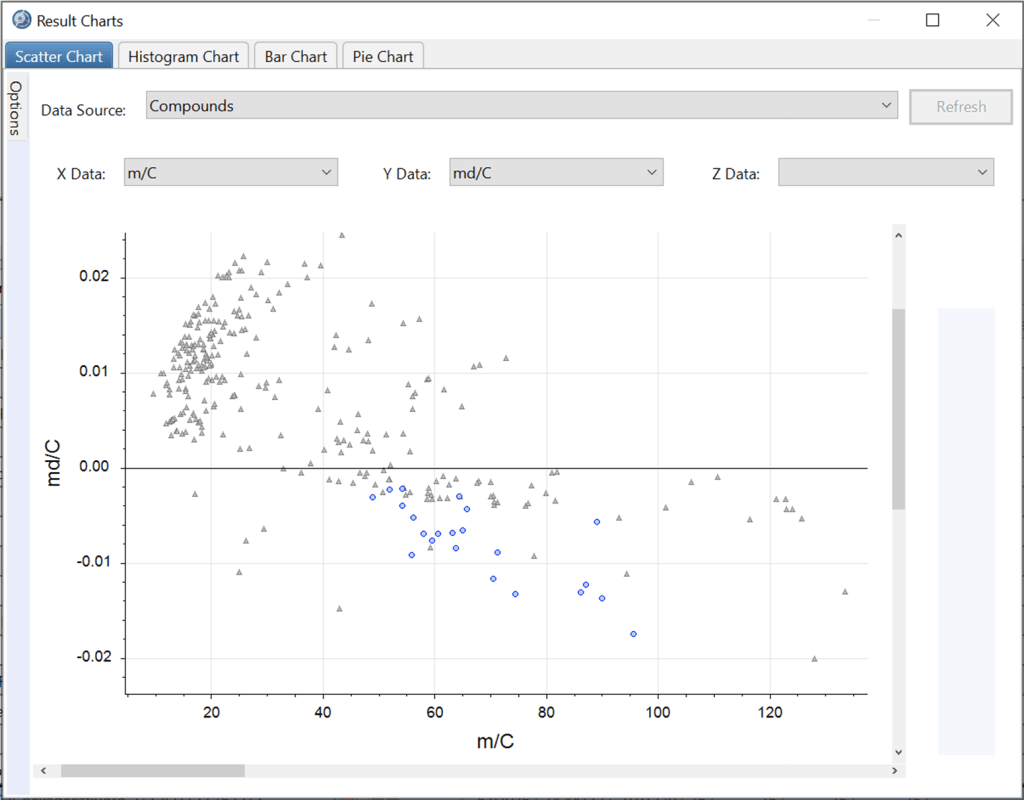
11.) PFAS Scripting node (R). 5/7/2024 Updated to version 1.10 (reduced memory usage & faster runtime)
Based on Kaufmann et al., Simplifying Nontargeted Analysis of PFAS in Complex Food Matrixes, https://doi.org/10.1093/jaoacint/qsac071
This script creates the columns related to https://doi.org/10.1093/jaoacint/qsac071
- “eC” (estimated number of carbons based on A1/A0 ratio),
- “m/C” (molecular mass / eC),
- “md/C” (mass defect / eC), and
For each compound, this script will extract the MS1 scan and calculate eC based on the ratio of A1 and A0 peak for the reference ion.
The script also creates some additional columns that can be helpful in the context of PFAS analysis
- “F”, the number of fluorine atoms in assigned Formula
- “maxF(EC)”: the maximum number of fluorine atoms out of all predicted compositions for this compound
- “maxF(CS)”: maximum number of fluorine atoms out of all ChemSpider Hits for this compound
- “maxF(ML)”: maximum number of fluorine atoms out of all Mass List Hits for this compound
12.) SIL_Area (R). Version 1.1. 8/1/2023 – Export stable isotope labeling results into Excel spreadsheets, including relative peak area for each isotopologue.
This script calculates relative peak area for each isotopologue (already corrected for natural abundance) and writes it into an Excel spreadsheet.
If compounds are marked using the Checked column in the Compounds table, then only those checked compounds are exported. If no compounds are checked then the script will export all compounds.

13.) CompoundsFindExpected.R 12/20/2023
Creates column “Expected Compounds” in Compounds table, indicating which Compounds have also been detected in Expected Compounds.

14.) InChI.R Updated on 07/25/2024. Fixed problem with conversion of structures that are coming from the NIST MSMS library.
Creates columns “InChI” and “InChIKey” in the Compounds table. Uses OpenBabel for the conversion.

15.) Annotation Confidence Scoring for CD3.5, 3.4, and 3.3. 01/14/2026

